HexTrace is a user-mode tool for tracing a binary’s execution in real-time. We developed it to speed up our understanding of malware we were analyzing. We wanted a tracing tool that:
- was lightweight
- would work without source code or debug information
- could avoid detection by anti-debugging techniques
- could operate in the face of obfuscation, packing, and other anti-analysis defenses
We ended up with a stealthy analysis tool that can trace instructions and function calls. It can works on binaries that are protected by a range of anti-analysis techniques. It can control, as well as monitor, a binary’s execution. Basically, it helps us understand malware faster.
How it works
HexTrace monitors a target binary using instruction rerouting, which lets it work at both the instruction and functional levels. It attaches to a binary by inserting some of its own code into the execution flow of the binary. It creates a trampoline, a set of instructions that will bounce execution from the target application to HexTrace. It then replaces a few bytes in the target binary with a jump to the trampoline at a point where HexTrace should be invoked. When this jump is hit, control of the binary’s execution is passed to HexTrace. Once HexTrace takes over it can inspect memory, registers, etc.
By default, HexTrace works at the instruction level. Each time one of its trampoline jumps is hit, HexTrace will log information about the state of the binary, insert a new jump to the trampoline after the previous one, and then execute the instruction from the target that was replaced by the first jump. This process repeats for every instruction in the target.
Instruction rerouting works well for tracing malware because it’s less obvious than using standard OS debugging hooks, but it's simpler to implement than a virtualization-based solution. A lot of malware will look for tools like debuggers, behaving different when such tools are detected.
Function tracing
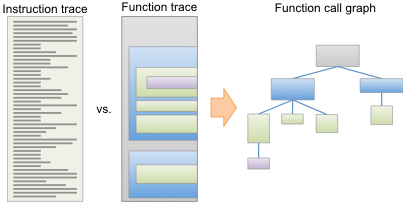
HexTrace can trace at the function level as well as the instruction level, which will produce a higher level picture of binary execution. It's the difference between seeing a list of several thousand assembly instructions versus seeing a list of a few function calls. Consider the figure at right. An instruction trace shows everything that executed, but it's basically a sea of instructions, with little context to indicate what the instructions are actually doing. A function trace, on the other hand, imposes a higher-level structure. Instead of a huge list of instructions, HexTrace can show a hierarchical list of function calls, or even a tree view. It can also add names to OS library functions it identifies, making it even easier to see what’s going on. These kinds of views let analysts understand how a binary works much more quickly that a simple instruction trace.
Control
Much like a typical debugger, HexTrace gets control of a binary before each instruction is executed, allowing it to change things as well as observe them. It can modifying data in memory, change return values, or even ignore certain instructions. Unlike a typical debugger, though, HexTrace can do all of this without operator intervention, making it usable while a target binary is running as usual. This very rootkit-like capability lets HexTrace actively avoid or subvert malware defenses.